
TL;DR:
- A structured home energy report workflow ensures UK property owners meet compliance and identify cost-effective efficiency measures. It involves analyzing 12 months of data, conducting on-site inspections, occupant interviews, and prioritizing measures based on payback periods. Proper execution of this process helps uncover invisible energy losses and maximizes financial and regulatory benefits.
A home energy report workflow is a structured sequence of steps designed to assess, analyse, and document residential energy use, enabling UK property owners and managers to achieve compliance and reduce running costs. With the Future Homes Standard and tightened Energy Performance Certificate (EPC) requirements reshaping the regulatory landscape in 2026, getting this process right is no longer optional. The workflow draws on interval meter data, thermal imaging, and energy management software to produce reports that satisfy both landlords and regulators. Understanding the full process, from data collection through to final reporting, is what separates a compliant property from a costly one.
What data and tools are essential for the home energy report workflow?
The residential energy review begins before anyone sets foot on site. Accurate reports depend entirely on the quality of inputs gathered in advance.
Gathering at least 12 months of interval usage data is the non-negotiable starting point. This period captures seasonal variation and exposes anomalies. Any unexplained jump of 20% or more in consumption signals either an equipment fault or a billing error, both of which distort the final report if left unaddressed.
The table below summarises the core tools and data types required before beginning a formal energy usage analysis:
| Tool or Data Type | Purpose | When to Use |
|---|---|---|
| 12-month interval meter data | Establish consumption baseline and identify anomalies | Before site visit |
| Thermal imaging camera | Detect insulation gaps and cold spots in walls and roofs | During on-site inspection |
| Portable energy monitor | Identify phantom loads and standby consumption | During inspection |
| Manometer or blower door | Measure air infiltration and draught levels | During airtightness testing |
| Energy management software | Collate, benchmark, and model consumption data | Throughout workflow |
Thermal cameras and energy monitors are particularly valuable because they reveal losses that billing data alone cannot show. A thermal camera identifies where insulation has failed; an energy monitor pinpoints appliances drawing power when they should be idle.
Selecting the correct audit level also matters. ISO 50002-2:2025 and ASHRAE 211 provide recognised frameworks for matching assessment depth to property type and budget. Applying the wrong level wastes money or leaves key savings undetected. For UK landlords working toward accurate energy estimates, starting with the right framework is the difference between a useful report and a compliance formality.
What are the step-by-step stages in the 2026 workflow?
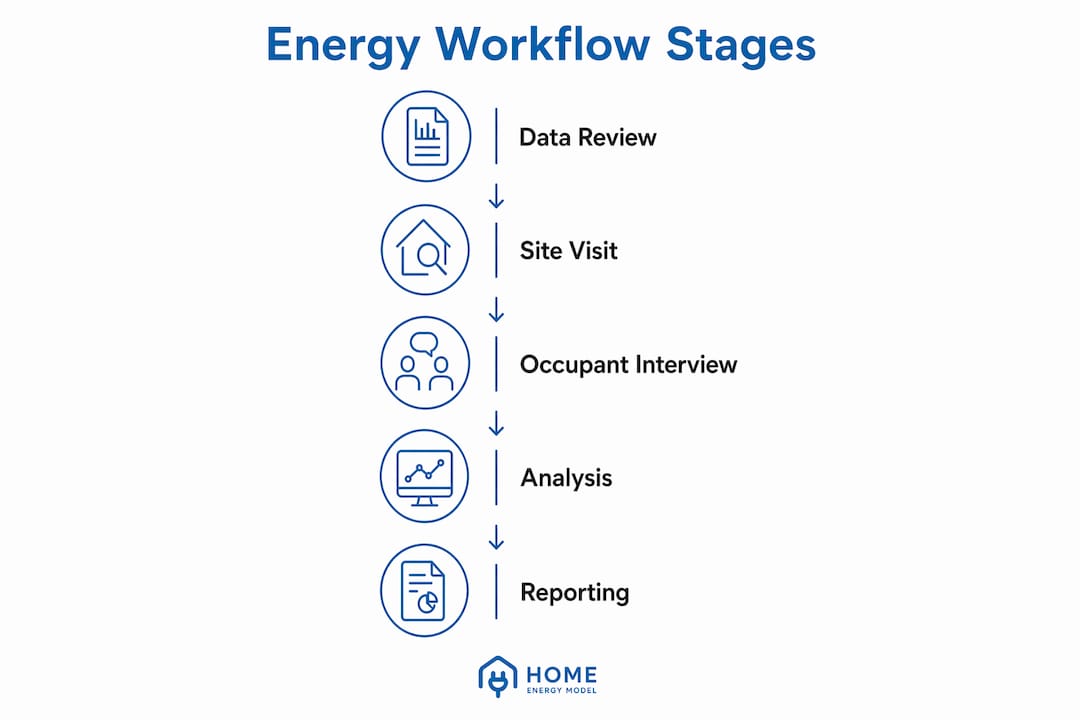
Professional energy audit workflows follow a five-stage process. Skipping or reordering stages risks missing 25–30% of potential savings. The sequence below reflects current best practice for UK residential properties.
-
Data Review. Collect and analyse 12 months of utility bills, interval data, and any existing EPC documentation. Flag consumption spikes and compare against benchmarks for similar property types.
-
On-site Inspection. Conduct a physical walkthrough using thermal cameras, energy monitors, and a manometer where airtightness testing is required. Document the condition of insulation, glazing, heating systems, and controls.
-
Operational Interviews. Speak with occupants or tenants about heating schedules, appliance use, and any comfort complaints. Occupant behaviour accounts for a significant share of actual consumption and must be captured in the report.
-
Opportunity Identification. Cross-reference inspection findings with consumption data to identify and rank Energy Conservation Measures (ECMs). Calculate indicative payback periods and savings potential for each measure.
-
Reporting. Produce the final energy savings report, ranking ECMs by return on investment and payback period. Include supporting evidence such as thermal images, meter readings, and benchmark comparisons.
Pro Tip: Complete the Data Review stage fully before booking the site visit. Arriving on site without a clear picture of consumption patterns means the inspection lacks focus, and inspectors frequently miss the highest-value opportunities as a result.
The energy audit process described above aligns with the home energy audit process guidance published by Homeenergymodel, which maps these stages specifically to UK compliance requirements for 2026.
How to assess and quantify invisible energy losses
Energy audits are engineering diagnostics, not billing reviews. The most costly inefficiencies rarely appear on a utility statement.

Air infiltration causes 20–30% of heating and cooling loss in older UK homes. Poor loft insulation alone can account for 25% of heat loss. Neither figure shows up as a line item on a gas bill, which is precisely why a structured inspection is required. For a detailed breakdown of how loft insulation affects running costs, the Homeenergymodel guide on loft insulation and energy bills provides property-specific context.
Hidden operational faults compound the problem. A fouled heat exchanger running at reduced efficiency, or heating operating outside occupied hours, generates costs that only a structured inspection will catch.
The comparison table below maps common invisible loss types to their mitigation measures:
| Energy Loss Type | Typical Cause | Mitigation Measure |
|---|---|---|
| Air infiltration | Failed seals, gaps around windows and doors | Draught-proofing, airtightness upgrades |
| Loft heat loss | Thin or degraded insulation | Loft insulation top-up or replacement |
| Phantom loads | Appliances on standby | Smart sockets, occupant guidance |
| Heating outside hours | Unoptimised controls | Programmable or smart thermostat |
| Glazing heat loss | Single glazing or failed double-glazed units | Secondary or replacement glazing |
Once losses are identified, each measure needs a payback calculation. Divide the installation cost by the annual saving to produce a simple payback period in years. Rank measures from shortest to longest payback to build a prioritised savings matrix. Well-structured audit reports serve as financial instruments, and this ranking can unlock utility incentive funding covering up to 40% of project costs.
Pro Tip: When presenting findings to tenants or co-owners, lead with the payback period rather than the upfront cost. A measure that pays back in three years is a financial decision, not a home improvement expense.
For a practical framework on how to assess home energy loss across different property types, Homeenergymodel provides step-by-step guidance tailored to UK residential stock.
What are the common challenges in executing the workflow?
Even well-planned residential energy reviews encounter avoidable problems. Knowing where workflows typically break down allows property managers to build in safeguards from the outset.
The most frequent mistakes include:
- Ignoring baseline data. Starting the inspection without reviewing historical consumption means the auditor has no reference point. Anomalies go undetected and the report reflects a snapshot rather than a pattern.
- Shallow on-site inspections. Limiting the walkthrough to visible areas misses loft voids, underfloor spaces, and service penetrations where significant losses occur.
- Failing to interview occupants. Tenant behaviour directly affects consumption. A report that ignores occupant schedules will overestimate the savings from technical measures.
- Poor data retention. Without structured records, year-on-year comparison becomes impossible. Annual re-audits during shoulder seasons, spring or autumn, preserve data continuity and establish reliable baselines for continuous improvement.
- Skipping safety checks on diagnostic tools. Thermal cameras and blower door equipment must be used in accordance with manufacturer guidance. Incorrect use produces misleading readings that undermine the entire report.
Energy audits that feed into ESOS and ISO 50001 compliance frameworks require documented evidence trails. Structured data retention is therefore both a best practice and a regulatory requirement for larger portfolios.
The home energy audit checklist published by Homeenergymodel provides a practical tool for UK landlords to verify that each stage of the workflow has been completed correctly before sign-off.
Key takeaways
A structured home energy report workflow, executed in the correct sequence with the right tools, is the most reliable method for UK property owners to achieve compliance and identify financially viable efficiency improvements.
| Point | Details |
|---|---|
| Start with 12 months of data | Interval usage data over 12 months reveals anomalies and establishes an accurate consumption baseline. |
| Follow the five-stage process | Data Review, Inspection, Interviews, Opportunity Identification, and Reporting must be completed in sequence to avoid missing savings. |
| Target invisible losses first | Air infiltration and poor insulation account for up to 30% of energy loss and rarely appear in billing data. |
| Rank measures by payback period | A prioritised savings matrix unlocks utility incentive funding of up to 40% of project costs. |
| Re-audit annually | Shoulder-season re-audits preserve data continuity and support continuous improvement under ISO 50001 and ESOS frameworks. |
Why most home energy reports miss the point
I have reviewed a significant number of home energy reports produced for UK landlords over the past several years, and the pattern is consistent. The technical data is present. The EPC rating is recorded. The recommended measures are listed. What is almost always missing is the financial framing that makes the report useful to a property owner rather than just a compliance document.
The shift from SAP to the Home Energy Model (HEM) in 2026 changes the methodology, but it does not automatically change the quality of the output. A report generated under HEM is only as useful as the workflow that produced it. If the data collection was shallow, if occupant interviews were skipped, or if the inspection missed the loft void, the HEM output will be no more reliable than a poorly executed SAP assessment.
The reports that genuinely drive decisions are the ones that translate kilowatt-hours into pounds. A landlord does not need to understand U-values. They need to know that upgrading loft insulation will reduce the annual heating bill by a specific amount and pay back the installation cost within a defined period. That framing comes from the workflow, not the software.
Software tools for data collation and modelling are improving rapidly, and integrating them into the workflow from the data review stage reduces manual error and speeds up report generation. However, no software replaces a thorough on-site inspection or a direct conversation with the occupant. The home energy habits workflow guidance from Homeenergymodel addresses exactly this gap, connecting occupant behaviour data to compliance outcomes in a way that purely technical reports rarely do.
The property owners who will be best positioned for 2026 compliance are not those with the most sophisticated tools. They are the ones who treat the energy report as a financial instrument and build a workflow that produces one.
— Danny
How Homeenergymodel supports your reporting workflow
Homeenergymodel provides practical resources for UK landlords and property managers who need to generate accurate, compliant home energy reports. The types of home energy models for landlords guide explains the different modelling approaches available under the 2026 regulatory framework and how each one affects EPC outcomes. For those working through the compliance process in London, the EPC guide for London properties covers certificate requirements, exemptions, and the practical steps needed to meet minimum energy efficiency standards. Both resources are designed to complement a structured reporting workflow and support property owners at every stage of the process.
FAQ
What is a home energy report workflow?
A home energy report workflow is a structured five-stage process covering data review, on-site inspection, occupant interviews, opportunity identification, and final reporting. It produces a documented assessment of a property’s energy use and recommended efficiency measures.
How much data is needed before starting an energy audit?
At least 12 months of interval usage data is required to establish a reliable consumption baseline. Unexplained increases of 20% or more indicate equipment faults or billing errors that must be resolved before the report is finalised.
What are the most common invisible energy losses in UK homes?
Air infiltration accounts for 20–30% of heating and cooling loss in older UK properties, and poor loft insulation can waste up to 25% of heat. Neither loss type appears clearly in utility bills without a structured inspection.
How does the home energy report support funding applications?
A well-structured report ranks Energy Conservation Measures by payback period and return on investment. This ranking is the basis for unlocking utility incentive funding that can cover up to 40% of project costs.
When should a property be re-audited?
Annual re-audits conducted during shoulder seasons, typically spring or autumn, preserve data continuity and provide the baselines needed for continuous improvement under ESOS and ISO 50001 compliance frameworks.