
TL;DR:
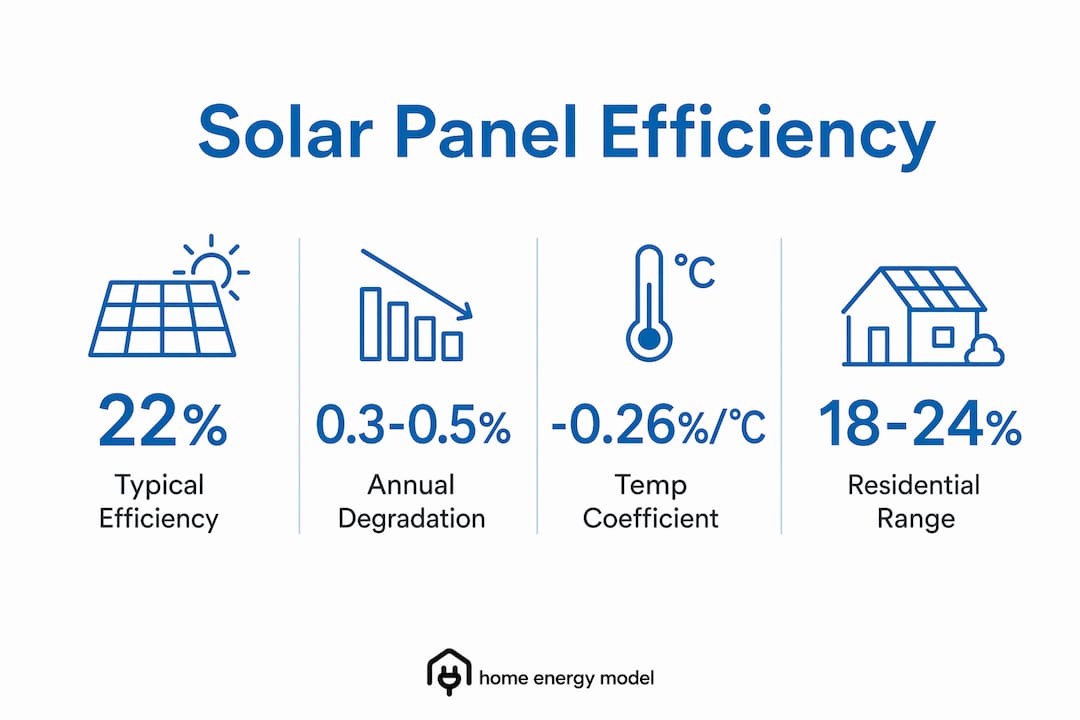
- Solar panel efficiency indicates the percentage of sunlight converted into electricity, with modern residential panels ranging from 15% to over 24%.
- Maximizing total system kWp within available roof space often yields better returns than chasing higher efficiency numbers alone, especially when space is limited.
Solar panel efficiency is defined as the percentage of sunlight that a panel converts into usable electricity, and for residential panels this figure typically ranges between 15% and 24%. The industry term for this measure is photoelectric conversion efficiency, and it directly determines how much power a given roof area can generate. For homeowners and property investors, understanding this metric is the foundation of any credible solar assessment. Advanced technologies such as TOPCon and HJT are now pushing premium panels beyond 22%, raising both energy savings potential and property value in ways that older polycrystalline systems simply cannot match.
What is the efficiency of a solar panel and how is it calculated?
The standard industry formula for solar panel efficiency is straightforward: Efficiency (%) = Power output (W) ÷ (Panel area (m²) × 1000 W/m²) × 100. This calculation is performed under Standard Test Conditions (STC), which specify an irradiance of 1,000 W/m², a cell temperature of 25°C, and an air mass of 1.5. STC provides a consistent benchmark so that panels from different manufacturers can be compared on equal terms.
The practical implication is that a 400W panel with an area of 1.8 m² achieves roughly 22% efficiency, while a 400W panel with an area of 2.0 m² achieves only 20%. Both deliver identical wattage, but the smaller panel is more efficient because it produces the same output from less surface area. This distinction matters enormously when roof space is limited.
Standard Test Conditions rarely reflect real-world performance, which depends on variables such as roof orientation, tilt angle, and local climate. Efficiency ratings should therefore be treated as performance potential rather than guaranteed output. A south-facing roof at 35 degrees in the south of England will consistently outperform the same panel installed on a north-facing slope in Scotland, regardless of the rated efficiency figure.
| Measurement factor | What it means in practice |
|---|---|
| Irradiance (1,000 W/m²) | Represents peak midday sunlight; real-world averages are lower |
| Cell temperature (25°C) | Cooler than panels typically run outdoors in summer |
| Power output (Watts) | The figure quoted on the panel datasheet |
| Panel area (m²) | Larger area for same wattage means lower efficiency |
Pro Tip: When comparing panels from different suppliers, always check the datasheet for both rated wattage and physical dimensions. Two panels with identical wattage can differ significantly in efficiency and footprint, which affects how many you can fit on a given roof.
What efficiency ranges and panel types are available for homes?
Modern monocrystalline panels typically offer efficiency between 20% and 22%, while polycrystalline panels range between 15% and 18%. Thin-film technologies vary from approximately 10% to 18% and are becoming less common for residential use. The gap between these categories has widened as monocrystalline manufacturing costs have fallen, making premium panels increasingly accessible to homeowners.
Residential panels broadly fall into three tiers:
- Budget panels (15–18% efficiency): Typically polycrystalline or older monocrystalline designs. Suitable for large roofs where space is not a constraint and upfront cost is the primary concern.
- Standard panels (18–20% efficiency): Modern monocrystalline PERC cells. The most common choice for UK residential installations, balancing cost and performance reliably.
- Premium panels (20–24%+ efficiency): N-type technologies including TOPCon and HJT. These carry a higher price per watt but deliver more power per square metre and tend to degrade more slowly over time.
The advancement driving efficiency gains in 2026 is the shift from P-type to N-type silicon cells. N-type cells are less susceptible to light-induced degradation, which means they maintain their rated output more reliably across a 25-year system life. For property investors focused on long-term asset value, this distinction is worth understanding before specifying a system.
| Panel type | Typical efficiency | Best suited for |
|---|---|---|
| Polycrystalline | 15–18% | Large roofs, budget-led projects |
| Monocrystalline PERC | 18–20% | Standard UK residential installations |
| TOPCon (N-type) | 21–23% | Space-constrained roofs, long-term returns |
| HJT (N-type) | 22–24%+ | Premium installations, high-performance targets |

The smart buildings energy efficiency landscape in 2026 increasingly favours N-type panels for new builds and retrofits where maximising kWp within a fixed roof area is a design requirement.
What real-world factors affect solar panel performance?
Rated efficiency and actual output diverge the moment a panel is installed on a real roof. Higher panel temperatures reduce efficiency by approximately 0.3–0.5% for every degree Celsius above 25°C, meaning a panel running at 40°C on a summer afternoon may operate at only 85–90% of its rated efficiency. This thermal loss is one of the most underestimated factors in residential solar assessments.
Shading is equally significant. Partial shading forces current through shaded cells, causing overheating and hotspots that reduce both immediate output and long-term panel lifespan. Because solar cells are wired in series, a single shaded cell can drag down the output of an entire string. A pre-installation shading assessment using tools such as a Solar Pathfinder or drone survey is not optional for serious investors; it is a prerequisite.
Degradation over time is a further consideration that affects the financial case for solar. Premium panels lose approximately 0.3–0.5% efficiency annually, retaining over 80% of their original capacity after 25 years. Standard panels degrade at 0.5–0.7% per year, which compounds to a meaningful output difference over a system’s lifetime. For a property investor modelling 20-year returns, the choice between a 0.3% and a 0.6% degradation rate is a financial decision, not merely a technical one.
The following factors collectively determine real-world solar output:
- Roof orientation and tilt: South-facing at 30–40 degrees delivers optimal UK yield.
- Temperature and ventilation: Panels mounted with adequate air gap beneath them run cooler and more efficiently.
- Shading from chimneys, trees, or neighbouring buildings: Even partial shading causes disproportionate output losses.
- Installation quality: Poor wiring, incorrect inverter sizing, and inadequate earthing all reduce system performance.
- Monitoring systems: Real-time output monitoring via platforms such as SolarEdge or Enphase allows faults to be identified and corrected promptly.
Pro Tip: Request the temperature coefficient figure from any panel datasheet before purchase. A coefficient of -0.26%/°C (as seen in some HJT panels) outperforms a coefficient of -0.45%/°C in hot weather, even if the rated efficiencies appear similar.
Higher efficiency versus more panels: what works for your roof?
The most common misconception in residential solar is that higher efficiency automatically means better value. A 22% efficient panel and a 20% efficient panel with the same wattage produce identical power output, but the 22% panel occupies less roof space. Efficiency is a measure of power density, not total power generation. This distinction reshapes the entire purchasing decision depending on available roof area.
The practical guidance for homeowners and investors breaks down as follows:
- Measure usable roof area first. Calculate the square metres available after accounting for chimneys, skylights, and setback requirements. This figure determines the maximum kWp the roof can accommodate at any given efficiency level.
- Calculate total kWp at different efficiency tiers. A 30 m² roof fitted with 20% efficient panels at 1.8 m² each accommodates approximately 16 panels at 400W, giving 6.4 kWp. The same roof with 22% efficient panels at 1.65 m² each could fit 18 panels, giving 7.2 kWp.
- Compare cost per watt, not efficiency percentage. In installations without roof space constraints, cost per watt matters more than efficiency percentage for overall financial returns. If standard panels at £0.65 per watt can fill the roof, paying £0.90 per watt for premium panels delivers no additional output.
- Factor in degradation rates for long-term modelling. A premium N-type system at 22% efficiency with 0.3% annual degradation will outperform a standard system at 20% with 0.6% degradation by year 15, even if the initial output is similar.
- Assess the EPC impact. Higher total kWp improves a property’s solar PV energy rating, which directly affects EPC band and, for rental properties, compliance with Minimum Energy Efficiency Standards (MEES).
For energy-efficient home upgrades where roof space is genuinely constrained, the premium for higher efficiency panels is justified. Where space is ample, the smarter financial decision is usually to install more standard panels and invest the cost difference in battery storage or insulation improvements.
Key takeaways
Solar panel efficiency is a power density metric, and maximising total system kWp within available roof space delivers better long-term returns than chasing headline efficiency numbers alone.
| Point | Details |
|---|---|
| Efficiency definition | Efficiency measures the percentage of sunlight converted to electricity, typically 15–24% for residential panels. |
| STC versus real-world output | Rated efficiency is measured under ideal lab conditions; actual output depends on temperature, shading, and orientation. |
| Panel type selection | N-type TOPCon and HJT panels offer 21–24%+ efficiency and slower degradation, making them suited to space-constrained roofs. |
| Temperature and shading losses | Efficiency drops 0.3–0.5% per degree above 25°C; partial shading can reduce whole-string output significantly. |
| Cost per watt over efficiency | Where roof space is not limited, cost per watt is a more reliable guide to financial returns than efficiency percentage. |
Why efficiency figures alone won’t tell you what your solar system is worth
Having worked across residential energy assessments and property investment projects, I’ve seen the same pattern repeat itself: a homeowner specifies the highest-efficiency panels available, pays a significant premium, and then installs them on a roof with three chimneys, a north-east orientation, and no shading assessment. The panels perform at 70% of their rated output, and the efficiency premium is entirely wasted.
The uncomfortable truth is that incremental efficiency differences between modern panels have far less practical impact than installation quality and system design. A well-designed 20% efficient system on a correctly oriented, unshaded roof will consistently outperform a poorly installed 23% efficient system. The efficiency figure on the datasheet is a ceiling, not a guarantee.
What I’d encourage any property investor to prioritise is total system kWp relative to roof constraints, a verified shading assessment, and a monitoring solution that flags underperformance in real time. The solar efficiency calculations that feed into EPC assessments reward total generation capacity, not panel efficiency ratings in isolation. Focus on what the system actually produces across a year, not what the panel is theoretically capable of under laboratory conditions.
— Danny
How Homeenergymodel can support your solar investment decisions
Homeenergymodel provides property owners and investors with detailed guidance on UK energy performance standards, including how solar PV systems affect EPC ratings and compliance with the upcoming Home Energy Model (HEM) methodology. Understanding how panel selection, system size, and installation quality translate into measurable energy performance improvements is central to making sound investment decisions. The site’s resources cover solar calculations, EPC assessment processes, and the practical steps needed to improve a property’s energy rating. For homeowners and landlords looking to assess the full impact of solar on their property’s performance, Homeenergymodel’s energy performance improvement guide is a practical starting point.
FAQ
What is a good efficiency rating for a residential solar panel?
Average residential solar panels achieve 18–20% efficiency, with premium models exceeding 24%. For most UK homes, a panel in the 20–22% range from a reputable manufacturer represents a strong balance of performance and cost.
Does higher efficiency mean more electricity generated overall?
Not necessarily. A higher-efficiency panel produces the same wattage as a lower-efficiency panel of larger size. Higher efficiency means more power per square metre, which matters most when roof space is limited.
How does temperature affect solar panel efficiency?
Panel efficiency falls by 0.3–0.5% for every degree Celsius above 25°C. Panels operating at 40°C on a warm summer day may run at only 85–90% of their rated efficiency as a result.
How quickly do solar panels lose efficiency over time?
Premium panels degrade at 0.3–0.5% per year and typically retain over 80% of their original capacity after 25 years. Standard panels degrade faster at 0.5–0.7% annually.
Does solar panel efficiency affect a property’s EPC rating?
Solar PV improves a property’s EPC rating by reducing net energy demand. Total system output in kWp carries more weight in EPC calculations than the efficiency percentage of individual panels.